
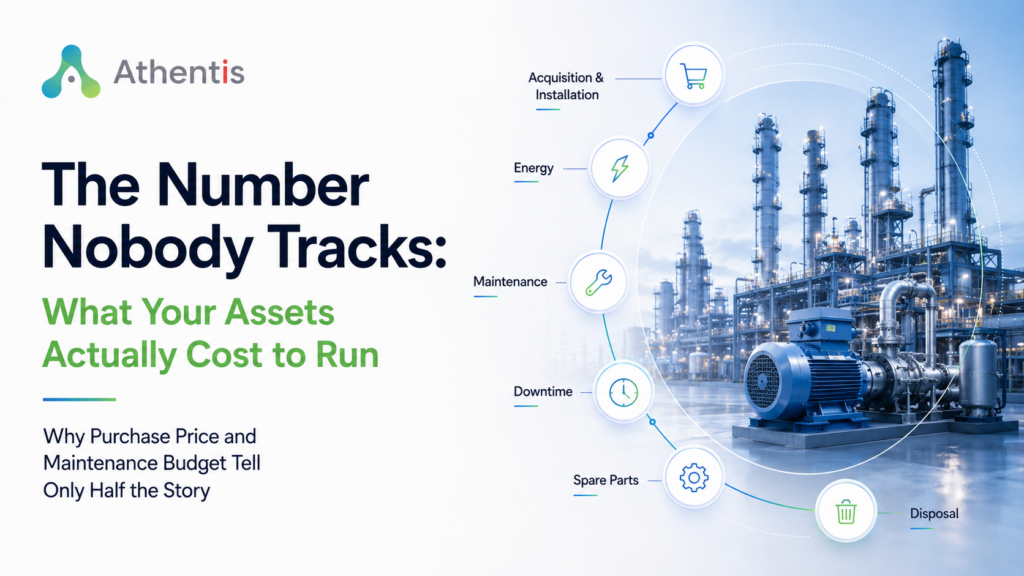
Why Purchase Price and Maintenance Budget Tell Only Half the Story
Most capital decisions in asset-intensive organizations begin and end with two numbers.
The cost to acquire the asset. And the annual budget allocated to maintain it.
These numbers are visible, they fit into standard financial models, and they are easy to defend in a budget meeting. They are also an incomplete picture of what an asset actually costs over its operating life.
The remaining costs are real, they are often substantial, and in most organizations they are distributed across enough budget lines that nobody ever adds them up. Energy consumption attributed to utilities. Downtime impact absorbed into production variance. Spare parts cost sitting in inventory reports. Disposal and decommissioning handled as a one-time project expense.
When an organization finally needs to justify replacing an asset, or compare the performance of two facilities, or decide whether to repair or retire a piece of equipment, it often finds that it cannot answer the most basic financial question: what has this asset actually cost us?
That question is the starting point for lifecycle cost management.
What Total Cost of Ownership Actually Includes
Total cost of ownership is a term that appears frequently in procurement discussions. In practice, it is rarely calculated with any precision in asset management environments.
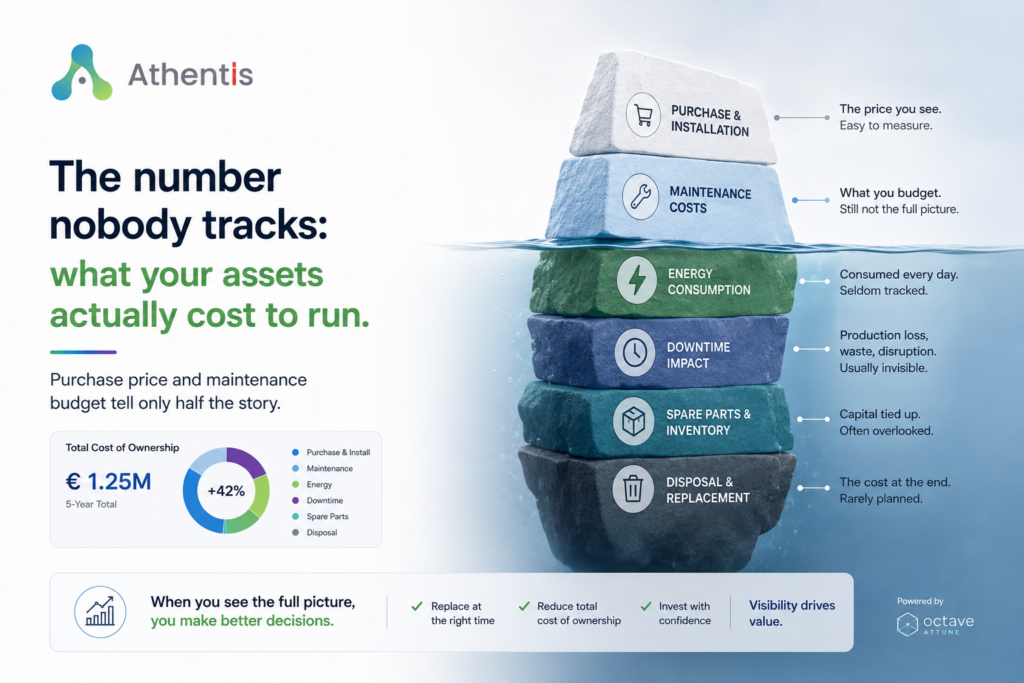
A complete lifecycle cost picture includes several elements that most organizations track separately, if they track them at all.
Acquisition and installation. The purchase price is the most visible cost, but installation, commissioning, integration with existing systems, and initial spare parts stocking all add to the true cost of bringing an asset into operation. These costs are often recorded against a capital project and then forgotten once the asset is in service.
Energy consumption over time. For industrial equipment, energy cost can represent a significant portion of total operating cost. An aging asset typically consumes more energy than a newer equivalent, but this increase is gradual and rarely connected back to the asset itself. It appears in utility bills, not in asset performance records.
Maintenance cost trajectory. Maintenance expenditure on a single asset is rarely stable across its operating life. Costs in early years are typically low. As equipment ages, intervention frequency increases, parts become harder to source, and technician time per event grows. When this trajectory is not tracked at the asset level, the true cost of continuing to operate aging equipment remains invisible.
Unplanned downtime contribution. When an asset fails unexpectedly, the direct cost of repair is only part of the financial impact. Production loss, product waste, schedule disruption, emergency procurement, and in regulated environments, compliance exposure all add to the real cost of that event. These costs do not appear in the maintenance budget. They appear in production reports, procurement records, and sometimes not at all.
Spare parts and inventory cost. Parts held specifically for a particular asset class represent a form of committed capital. When an asset is approaching end of life, the parts held for it may be approaching obsolescence. That cost is rarely attributed to the asset.
Disposal and replacement transition. Decommissioning, disposal, and the cost of transitioning to a replacement asset, including temporary capacity loss and retraining, are typically handled as project costs. They are not normally factored into the operational cost history of the outgoing asset.
When these elements are brought together, the financial picture of an asset across its operating life often looks substantially different from the simplified view that most organizations carry.
Why This Gap Creates Expensive Decisions
The practical consequence of incomplete lifecycle cost visibility is that capital decisions are made with limited evidence.
An asset is retained past the point where replacement would be economically justified because the maintenance cost, while increasing, does not cross any obvious threshold when viewed in isolation. The energy overconsumption is attributed to the facility rather than the equipment. The downtime events are treated as individual occurrences rather than a pattern with a financial trajectory.
When the replacement case is eventually built, it is built on age and condition assessment rather than financial evidence. The decision is justified through intuition and experience rather than through a clear comparison of continued operation cost against replacement cost.
In some organizations, this leads to assets being replaced too late. Equipment operates through an extended period of declining efficiency and increasing risk that could have been avoided with an earlier, planned replacement.
In others, the opposite occurs. Assets are replaced too early because their true performance is not understood, and the assumption is that newer is always better financially. Without lifecycle cost data, this assumption is difficult to test.
In both cases, the root cause is the same. The financial data needed to make an evidence-based decision exists within the organization. It is distributed across systems and budget lines in a way that prevents it from being used.
What Changes When Lifecycle Cost Is Structured in EAM
Enterprise Asset Management platforms are well positioned to address this gap because they already sit close to the financial reality of how assets perform.
Work orders carry cost. Inspection records carry labor time. Failure events carry downtime duration. Spare parts consumption is recorded against specific assets. When this information is structured consistently and linked to the asset record, total cost of ownership becomes something the organization can actually calculate.
Octave Attune supports this model directly. Asset hierarchies connect cost data to specific equipment rather than to generic categories. Work order cost allocation allows maintenance expenditure to be tracked at the asset level across the full operating life. Energy monitoring integrations allow consumption to be attributed to specific assets rather than absorbed into facility totals. Failure mode analysis connects downtime events to financial impact over time.
When configured with lifecycle cost visibility in mind, the platform enables an organization to answer questions it previously could not.
What has this asset cost in total across the past five years, including maintenance, downtime, and energy? How does that compare to a newer equivalent? At what point does continued investment in this asset exceed the cost of replacement? Which assets in the fleet are generating disproportionate cost relative to their output?
These are not maintenance questions. They are financial questions. And they can only be answered when asset data is structured to support them.
The Practical Impact on Capital Decisions
Organizations that develop genuine lifecycle cost visibility tend to manage capital decisions differently.
Replacement discussions move earlier. When the financial trajectory of an aging asset is visible, the conversation about replacement begins when intervention is still planned and affordable, not after an unexpected failure forces the issue. This shift alone typically reduces the total cost of replacement by removing urgency from the process.
Investment cases become defensible. When a capital request includes a full cost comparison between continued operation and replacement, including projected maintenance cost trajectory, downtime risk, and energy efficiency delta, it is a materially stronger case than one based on asset age and general condition. Finance and senior leadership can evaluate it properly rather than relying on the maintenance team’s judgment.
Procurement becomes more precise. When lifecycle cost data informs procurement decisions, asset specifications reflect operational performance requirements rather than just purchase price. Lower upfront cost may be rejected in favour of better long-term economics, with the data to support that position.
Multi-site comparison becomes possible. When lifecycle cost is tracked consistently across facilities, organizations can identify where similar assets are performing differently, which sites are generating disproportionate cost, and where maintenance practice is contributing to or reducing total cost over time.
Why This Matters Across Athentis’s Core Sectors
For manufacturing organizations, lifecycle cost visibility directly affects production economics. Equipment that consumes more energy, requires more frequent intervention, and generates more unplanned downtime is a direct drag on cost per unit. Understanding this at the asset level enables targeted investment decisions.
For food and beverage operators, the combination of regulatory compliance requirements, cold chain integrity, and high-volume production schedules makes asset reliability and total cost management particularly important. An unplanned failure that disrupts temperature control or contaminates a production batch carries financial consequences well beyond the maintenance cost of the event itself.
For facilities management organizations, lifecycle cost modeling across building systems, HVAC, elevators, and critical infrastructure is directly relevant to contract performance, service level commitments, and long-term asset replacement planning.
For fleet operations, understanding the point at which a vehicle or piece of equipment costs more to maintain than it generates in utilization value is a direct input to fleet renewal decisions and asset rotation strategy.
In each sector, the underlying logic is the same. Better cost visibility produces better decisions.
The Role of Octave Attune
Octave Attune provides the data architecture required to support lifecycle cost management at scale.
Asset hierarchies allow cost data to be attributed at the equipment level rather than the facility or department level. Work order structures capture labor, parts, and subcontracted cost in a consistent format. Failure records connect downtime events to financial impact. Condition monitoring supports the shift from calendar-based maintenance intervals to condition-based intervention timing, which has a direct effect on total cost across the operating life.
When configured with lifecycle cost visibility as an explicit objective, the platform moves beyond recording what was done and begins answering what it cost, and whether that cost is justified by the value the asset continues to deliver.
The Role of Athentis
Athentis supports organizations in structuring their EAM environments to produce genuine lifecycle cost visibility.
This involves aligning asset hierarchies with cost allocation requirements, standardizing how maintenance expenditure is captured and attributed, connecting operational performance data to financial reporting, and building the analytical frameworks that allow lifecycle cost comparisons to be made reliably.
The goal is not to produce more reports. It is to ensure that capital and maintenance decisions are made with a complete financial picture of the assets involved.
Most asset-intensive organizations have the data required to understand what their assets actually cost to run. It exists in maintenance records, procurement logs, utility invoices, and production reports.
The challenge is that it is distributed across systems and budget lines in a way that prevents it from being brought together into a clear financial picture.
When that picture is assembled inside a well-structured EAM environment, the quality of capital decisions improves. Assets are replaced at the right time, for the right reasons, with evidence that can be defended at any level of the organization.
The question is not whether the data exists.
It is whether it is structured in a way that makes the true cost of your assets visible before the decision has already been made. much of it leaves when they do.

