

Why the maintenance budget is one of the least evidence-based numbers in an industrial business, and how to change that before the Q4 round closes
Somewhere between now and the end of November, in almost every asset-intensive business in Greece and Cyprus, a maintenance manager will be asked for a number.
The process is familiar. Last year’s actuals come out of the finance system. They are adjusted for inflation, for known projects, for a contract that is due to be renewed. The result is submitted. It is challenged. It is trimmed by a round percentage that applies to every department equally. It is approved.
Time spent discussing what the number actually buys: often close to zero.
The number will be wrong, and not because of the arithmetic. It will be wrong because it was never built as an argument. It was built as a continuation.
That matters more this year than usual. Sites across Greece and Cyprus have just come through a hard summer, and the reviews that follow a season like that tend to surface work that nobody has budgeted for. The Q4 budget round is where that work either gets funded or quietly becomes next year’s problem.
The Problem With Starting From Last Year
Incremental budgeting has one obvious flaw that almost never gets said out loud in the meeting. The baseline already contains last year’s failures.
Emergency callouts. Premium freight on parts that were needed the same day. Overtime worked at the weekend. Contractor rates agreed under pressure, which are never the rates you would have agreed with two weeks’ notice. All of that lands in maintenance actuals, and all of it becomes the starting point for next year.
So the budget quietly encodes last year’s dysfunction as the normal cost of running the business. Worse, it does it invisibly. A well-run operation and a struggling one both submit a number built the same way, and on paper the two submissions look similar. The struggling one is asking to fund another year of firefighting, and usually gets it, because nobody in the room can see the difference.
There is a second problem. A single number is uniformly cuttable. When a 7% reduction is applied across the business, nobody can say what it removed, because the budget was never separated into things that can be cut and things that cannot. The maintenance manager finds out in March.
Why Maintenance Tends to Lose the Budget Argument
Maintenance is one of the few functions routinely asked to justify spending on events that have not happened yet.
Sales forecasts revenue that has not happened and is funded on that basis. Maintenance forecasts failures that have not happened and is asked to prove it. The difference is not fairness. It is that revenue forecasts come with a model and failure forecasts usually come with a story.
Then there is the timing asymmetry, which is the real issue. A cut produces an immediate, certain, visible saving in this year’s plan. The cost of that cut arrives later, is uncertain, and lands somewhere else entirely: in production variance, in procurement premiums, in overtime, in scrapped product, sometimes in a compliance finding. By the time it shows up, the saving has already been booked and credited to someone.
This is the annual version of the same information gap that drives the weekly argument between maintenance and production. The cost of acting is visible. The cost of not acting is not.
None of this is a criticism of finance. Finance is making a reasonable decision with the evidence in front of it. When that evidence is one number and a verbal case, the decision goes the way it always goes.
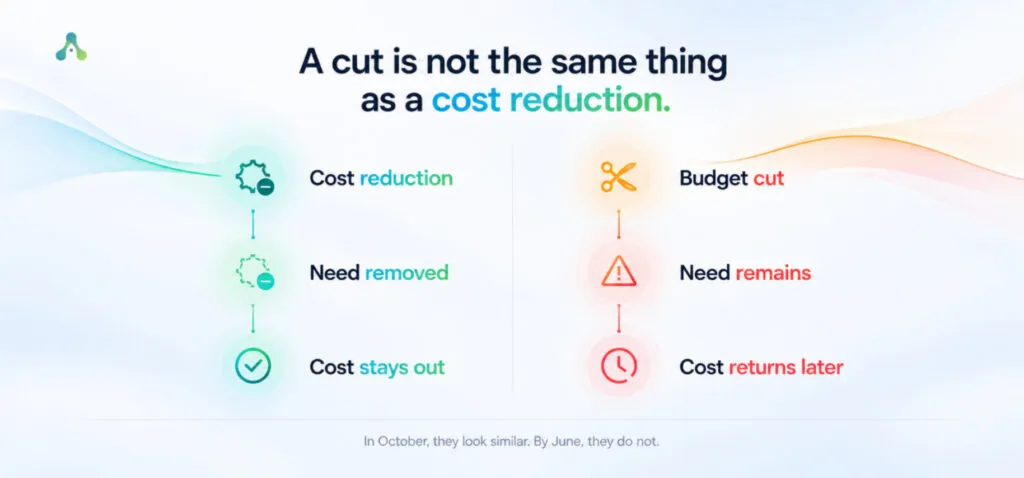
A Cut Is Not the Same Thing as a Cost Reduction
These two get used interchangeably in budget meetings, and they are not the same at all.
A cost reduction removes the need for the spending. You eliminate a preventive task that has never found anything on an asset where failure carries little consequence. You standardize a part across three sites and stop holding three versions of it. You fix the chronic failure that has been generating the same corrective work order every six weeks for two years. You move an asset from a fixed interval to condition-based intervention, because you now have the data to justify it. The money goes away and does not come back.
A cut removes the money and leaves the need. The work still needs doing. It has simply moved into a future year, and no decision about that was ever formally made or recorded.
In the October budget file, the two look identical. In June, they look nothing alike.
The reliability consultancy IDCON has documented what the second one can eventually cost. A pulp mill ran a cost reduction initiative that brought annual maintenance spending down from roughly 35 million dollars to around 27 million. For the first few years it was reported as a success, which it was, by the measure being used. Reliability then began to fall, from 93% at the start of the programme to a low of 78% six years later, during a period when pulp prices had doubled and every lost ton was worth more than usual. IDCON’s conservative estimate of the financial loss over a three-year window was more than 1.2 billion dollars.
The saving was real, and it was recorded in the maintenance budget. The loss was far larger, and it was recorded somewhere else.
The point is not that maintenance budgets should never be reduced. Plenty of them contain genuine waste, including preventive routines that exist only because someone set them up years ago and nobody has reviewed them since. The point is that a cut and a cost reduction have to be told apart before the decision is made, not discovered afterwards.
What a Defensible Maintenance Budget Actually Contains
The practical fix is to stop submitting one number. Split it into categories that are defended differently, because they are different kinds of commitment.
Statutory and compliance work. Legal inspections, pressure equipment, lifting gear, instrument calibration, refrigerant handling, hygiene-related verification. This is not discretionary spending, and it should be costed and presented separately so that nobody trims it by accident.
The preventive programme. This comes straight out of the maintenance schedule: task volumes for the year ahead, labour hours, parts. In a well-structured system this number is calculated rather than estimated, which makes it considerably harder to argue with.
Expected corrective work. Most organizations have several years of failure history sitting in their system and forecast corrective spending by feel anyway. Build it from the history instead, at asset class level. It will not be exact. It will be defensible, which matters more.
Improvement and reliability work. The projects that remove future cost rather than repeat it: chronic failure elimination, criticality-driven strategy reviews, condition monitoring on the assets that keep failing. This category competes with every other investment in the business, so it needs a return attached to it, expressed in avoided downtime or avoided corrective cost.
Contingency. Sized from the actual distribution of unplanned events over the last three years, not set at a round percentage because that is what was used last time.
Three things should travel with the submission.
The backlog, measured in hours and trended over the past 24 months. A backlog that grows steadily in hours is the clearest evidence a maintenance leader has that demand exceeds capacity, and it is much harder to dismiss than a general sense that the team is stretched.
Asset-level cost history, so the number is built from the bottom up. When you can show which assets are consuming a disproportionate share of the budget, the conversation shifts from how much maintenance costs to what specific equipment costs to keep running, which is a far more productive discussion to have with finance.
And options rather than a single figure. State what the full programme delivers. State what changes at minus 10%: which tasks move to longer intervals, on which assets, with what consequence. State what is deferred at minus 20%. This is the step that changes the nature of the meeting. It converts a negotiation about a number into a documented decision about risk, and it puts that decision where it belongs, with the people who own the risk.
Benchmarks Are Useful Until They Become Targets
The standard benchmark here is maintenance cost as a percentage of replacement asset value. Annual maintenance spend divided by what it would cost to replace the assets at today’s prices. SMRP publishes it as a best practice metric, and the widely quoted rule of thumb puts best-in-class performance somewhere around 2% to 3%.
It is genuinely useful, because it normalizes for plant size and lets you compare sites that are otherwise very different.
It is also easy to misuse. The right figure varies enormously by industry, so a ratio that is excellent in one sector is unremarkable in another. Definitions vary too: contractors in or out, turnarounds in or out, capital work in or out. Two sites that appear to be performing differently are often just counting differently.
The bigger risk is the one the pulp mill demonstrates. A plant can produce an excellent ratio for several years simply by not doing the work. The number improves while the condition of the asset base quietly deteriorates, and by the time reliability falls far enough to be noticed, several years of deferred work have accumulated.
So use it, but use it honestly. Track your own ratio over time with one written definition, and never read it on its own. Put it next to a reliability measure, such as availability or the percentage of work that is planned. A cost ratio that falls while availability falls with it is not efficiency. It is deferral, showing up early, in the one place it can still be caught.
What This Looks Like Across Different Operations
In manufacturing, the strongest position is a budget argued against production economics rather than presented as a support cost. If the cost of an hour of downtime on each line is known, most of this conversation resolves itself.
In food and beverage, a substantial part of the budget is not discretionary in any meaningful sense, because it is tied to hygiene, cold chain integrity, traceability and audit readiness. Underfunding here shows up as compliance and recall exposure, not only as downtime. That portion should be identified clearly so it never ends up in the trimming pile by default.
In distribution and fleet operations, the maintenance budget and the replacement cycle are one conversation, not two. Deferring maintenance on ageing vehicles and handling equipment raises running cost and reduces availability at the same time, which is why fleet decisions need both numbers in the same room.
In equipment service management and rental, maintenance is not overhead at all. It is cost of goods sold. Every unit that is not serviceable is not rentable, so an underfunded maintenance budget appears first on the revenue line as lost utilization. Budgets in this sector are best argued per unit of fleet and against utilization targets, where the link to income is direct and easy to demonstrate.
The Role of Octave Attune EAM
Octave Attune EAM, formerly HxGN EAM, holds most of the evidence this argument needs. Whether that evidence is usable depends on how the system has been set up.
Work orders capture labour, parts and contractor cost against specific assets, which is what makes bottom-up budgeting possible. The preventive schedule gives forward task volumes and estimated hours for the year ahead, so the largest planned category can be calculated instead of guessed. Failure history supports a corrective forecast grounded in what has actually happened. Backlog can be reported in hours and trended rather than counted. Budget and actual can be tracked through the year by category, asset class and site, which means the next submission starts from a record rather than a recollection.
Across multiple sites, none of this comparison works unless hierarchies, cost structures and failure coding are consistent between them. That consistency is what turns a set of separate site budgets into a single organizational picture.
The Role of Athentis
Athentis has spent more than 30 years working with asset-intensive organizations in Greece and Cyprus, and the budget round is one of the moments where the quality of an EAM environment becomes very visible.
In practice, that means structuring cost capture so actuals can be attributed to specific assets rather than absorbed into general maintenance, and separating committed spending from discretionary spending so both can be defended properly. It also means building the corrective forecast from failure history, and setting up reporting that tracks the budget through the year rather than reviewing it once it has been spent.
The objective is straightforward. The maintenance leader should walk into the budget meeting with a model, not a request.
Before the Number Is Fixed
The budget will be approved either way. A figure will go into the plan, the year will be run against it, and by February it will feel like it was always going to be that number.
The only real difference is whether it was set deliberately or arrived at by arithmetic.
Every organization makes a risk decision in the Q4 budget round. Most make it without writing it down, without naming what was deferred, and without anyone formally accepting the consequence. Then they find out what they chose about eight months later, usually on a bad day.
There are a few weeks left before this year’s number is fixed.
A maintenance budget is not a request for money. It is a decision about how much risk the business will carry next year. Make sure it is made that way.

